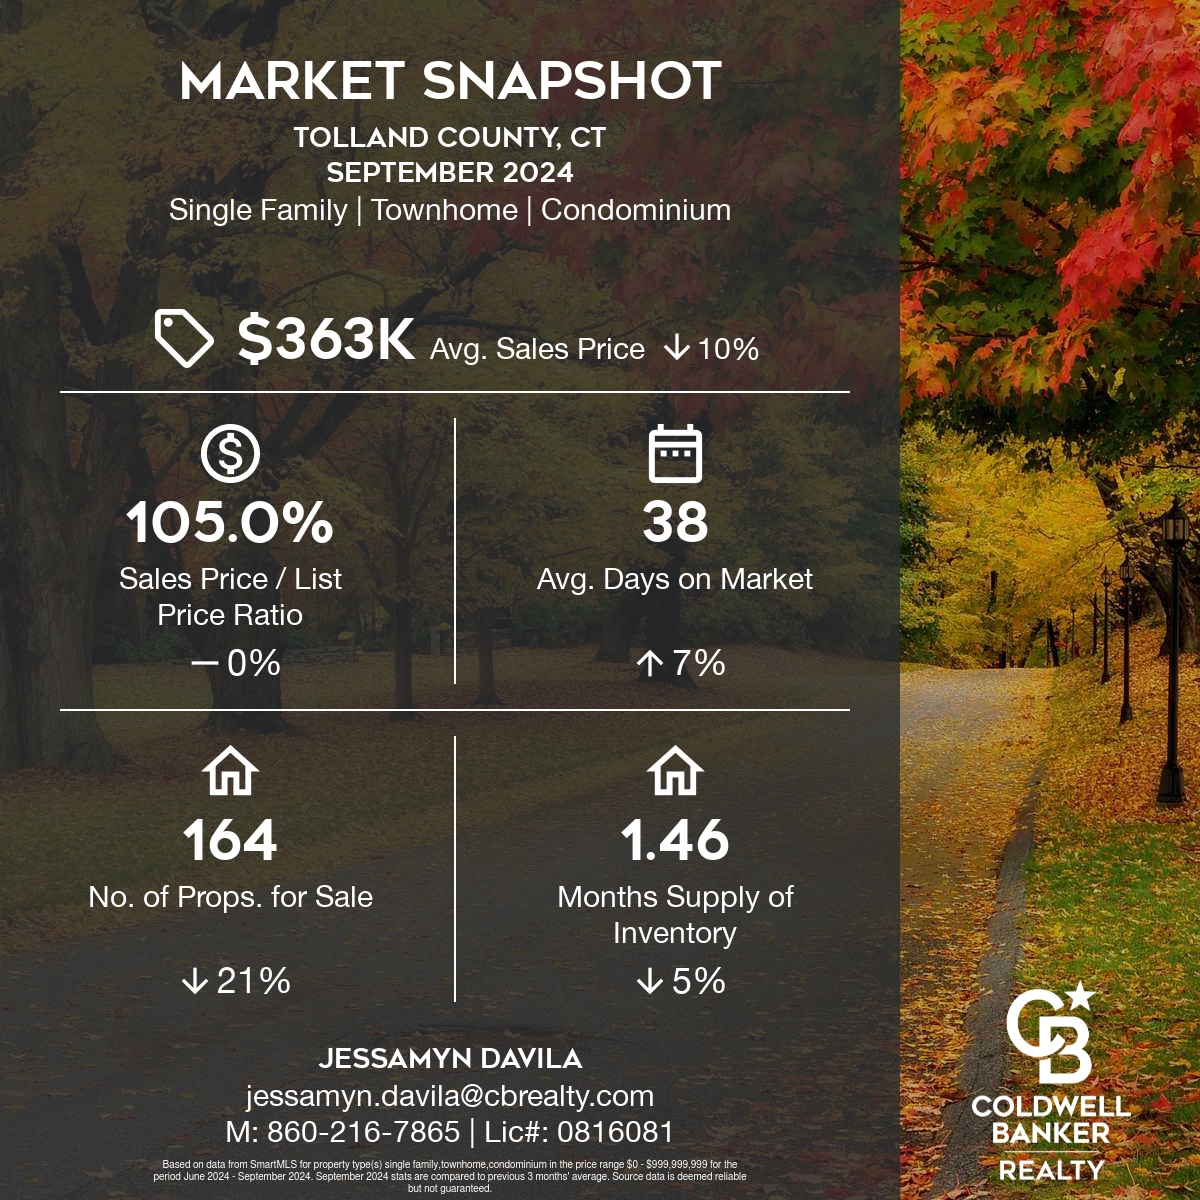
Here’s your September 2024 Market Update for Tolland County. This report provides an in-depth look at the latest real estate trends, economic shifts, and key market indicators shaping the region. Whether you’re a homeowner, investor, or simply interested in the local market, this update will offer valuable insights to help you stay informed.
Average & Median Sales Price

-
Median Sales Price:
- September 2024: $360,000
- August 2024: $400,000 (a 10% decrease month-over-month)
- September 2023: $350,000 (a 2.86% increase year-over-year)
Despite the month-over-month decline, the median sales price in September 2024 was still at its highest level compared to September 2023 and 2022.
- Average Sales Price:
- September 2024: $363,309
- August 2024: $406,980 (a 10.73% decrease month-over-month)
- September 2023: $368,131 (a 1.31% decrease year-over-year)
The average sales price in September 2024 was lower than both the previous month and the same time last year, putting it at a mid-level compared to September 2023 and 2022.
This data indicates a cooling in the market month-over-month, but the median sales price has still seen a modest increase compared to the same time last year.
Sales Price / List Price Ratio

The sales price/list price ratio for September 2024 was 104.95%, meaning homes were selling for 4.95% more than the list price. This ratio remained unchanged compared to both the previous month (August 2024) and the same period last year (September 2023).
Number of Properties Sold & Absorption Rate

The real estate market in September 2024 experienced a noticeable drop in sales volume:
- Number of Properties Sold:
- September 2024: 112 properties
- August 2024: 149 properties (a 24.83% decrease month-over-month)
- September 2023: 120 properties (a 6.67% decrease year-over-year)
This marks the lowest sales level compared to both September 2023 and 2022, indicating a slowdown in market activity.
- Absorption Rate: The absorption rate is calculated by dividing the average number of sales per month by the total number of available properties. It reflects how quickly homes are selling relative to the current supply. A high absorption rate generally means a fast-moving market, while a low absorption rate indicates slower sales.
The drop in the number of properties sold, despite a strong sales price/list price ratio, could signal a cooling demand or a tightening inventory that might influence future price dynamics and market absorption rate. If you provide the total number of available properties, we can calculate the exact absorption rate for September 2024.
Inventory & MSI

Here’s a more detailed breakdown of the real estate market conditions for September 2024:
1. Inventory and Sales:
- Number of Properties for Sale:
- September 2024: 164 properties
- August 2024: 195 properties (a 15.90% decrease month-over-month)
- September 2023: 244 properties (a 32.79% decrease year-over-year)
This shows that the inventory is at its lowest level compared to the same period in 2023 and 2022, reflecting fewer available homes for sale, which often supports stronger pricing.
2. Months of Supply Inventory (MSI):
- September 2024 MSI: 1.46 months, meaning it would take roughly 1.46 months to sell all the available inventory at the current sales pace.
- This was the lowest MSI compared to September 2023 and 2022, signaling a strong seller’s market, where demand exceeds supply. A lower MSI benefits sellers because homes sell quickly, often leading to higher prices.
Key Takeaways:
- The market is clearly tight with declining inventory and a low MSI, benefiting sellers.
- The absorption rate suggests properties are moving swiftly, while the low MSI reflects increased competition among buyers for limited listings.
- Despite fewer sales and properties sold, the 104.95% sales price/list price ratio shows buyers are still willing to pay over the list price.
- Homes are consistently selling above the list price, suggesting strong demand or limited inventory.
- The fact that the sales price/list ratio remained stable at 104.95% across the past year indicates a persistent seller’s market, where buyers may be competing for properties, driving up sale prices above the listed values.
Click here to access the full report with additional data.
Sign up here for Neighborhood News – The Real Estate Market scoop for the community you love.


 Facebook
 X
X
 Pinterest
 Copy Link
